
Piero Sraffa’s Standard Commodity
Explaining it to you (and myself) through numerical examples

In his widely praised book “The Production of Commodities by Means of Commodities” (published in 1960) the Italian economist Piero Sraffa used (in part) an example of a three commodity economy to explain his idea of a “Standard Commodity”.
The “actual” hypothetical system
Imagine an economy that produces iron, corn and wheat. It produces just as much iron as it uses every year but manages to produce a surplus of corn and wheat. Each of these outputs of the economy are also inputs for each industry. The economy generates the same surplus every year. Some of the surplus goes to owners (capitalists) and the rest goes to workers. Below is how Sraffa described it
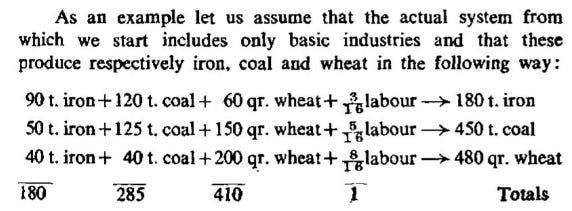
The economy produces no surplus of iron, a 165 unit surplus of corn (480-285) and a 70 unit surplus of wheat (480-410).
As a system of equations it look like this
Eq 1: (90pi + 120pc + 60pw)(1+r) + 3/16w = 180pi
Eq2: (50pi + 125pc + 150pw)(1+r) + 5/16w = 450pc
Eq3: (40pi + 40pc +200pw)(1+r) + 8/16w=480pw
where
pi = price of iron
pc=price of corn
pw=price of wheat
r = rate of surplus
w= the total wage bill in the economy
As is clear from the equations, Sraffa assumes the percentage surplus is the same for each industry. We have three equations and five unknowns. One way to solve the equations is to choose values for two of the unknowns then solve for the other three.[1] For example, if we set pi =1 and r = 0.10 these are the values we end up with for the other unknowns:
pc=0.389948216, pw= 0.32086227,
w=44.53293726
Not terribly meaningful is it?
But there is a way to get a more interesting solution. Instead of arbitrarily picking one of the prices and setting it equal to one (or some other number), suppose we set the total value of the surplus of the economy (the net national income) equal to 1. Recall that the economy produces a 165 unit surplus of corn and a 70 unit surplus of wheat. If we multiply the quantity surplus of each by the price of each and add those values up we get the net national income. Set it equal to one and we get a fourth equation out of it:
165pc + 70pw = 1
With the net national income set equal to one we can now define “w” as some fraction (between 0 and 1) ) of the national income that went to workers. We again set r to 0.10 and now solve four equations (below) which have four unknowns. (The first three equations are the same as those above just rearranged a bit):
Eq 1: [90(1+r)-180]pi + 120(1+r)pc + 60(1+r)pw + 3/16w = 0
Eq 2: 50(1+r)pi + [125(1+r)-450]pc + 150(1+r)pw + 5/16w = 0
Eq 3: 40(1+r)pi + 40(1+r)pc + [200(1+r)-480]pw + 8/16w = 0
Eq 4: 165pc + 70pw = 1
We get the following solution:
pi=0.011520497, pc=0.004492397, pw=0.003696493
w=0.513041548
The value of w now tells us that very close to half the net national income goes to workers if the rate of surplus for each commodity is 0.10 (which expressed as a percentage is 10%).
If we solve the system of equations repeatedly for different values of r between 0 and 20%, this is what we come up with for w.

Each value of r also gives us different values for pi, pc and pw but always such that equation 4 is satisfied: the national income is equal to 1. If we solve the four equations for values of r greater than 20% we start getting negative values for pi, pc and pw. So 20% is the maximum rate of surplus in our example that yields solutions that make economic sense because all prices have to be positive numbers.
When w is equal to one, workers get the entire surplus (or national income). The rate of surplus can be thought of as a profit rate. At the maximum profit rate, workers get a zero share of the national income. However, note from the table that the relationship between r and w is not a simple straight line. If it were, then second, third and fourth “w” values in the table would be exactly 0.750, 0.500, and 0.250.
Sraffa explains that some industries use more workers than others. Industries with the highest labour costs relative to other inputs (ie. means of production) get more profits the lower w goes below 1. But industries that use relatively little labor would go into deficit if prices did not adjust because the savings from lower wages would not offset the cost of paying out the going rate of profit. But it is even more complicated, Sraffa then adds, because how prices adjust also depends on labour costs relative to other costs in the suppliers to the industries.
Luigi Pasinetti’s “Lectures on the Theory of Production” (published 1977) explains it using the graph below

The curve relating the profit rate and the wage rate is a complicated polynomial curve that has a different shape depending on how we set prices to make the system of equations solvable.
Extracting the Standard System from the “actual” system
Sraffa devised a way to show that the relationship between the profit and wage rate is in fact always a straight line for an “actual” system (even if it is vastly more complex than the three-commodity example we’ve been discussing). If we express prices in terms of a special “standard commodity”, we can eliminate prices from the relationship between w and r.
I will stick to Sraffa's simple example to explain the “Standard Commodity”. The numerical example is not the mathematical proof Sraffa provided using basic algebra (and that Pasinetti provided using matrix algebra), but the example is an easy way (the easiest in my opinion) to explain the concept.
Remember the first three equations in our example? If we multiply every term in Eq 1 by 4/3, every term in Eq 2 by 4/5, and keep Eq 3 as is (ie. multiply each term in Eq 3 by 1) then we get the following system of equations [2]:
Eq1b: (120pi + 160pc + 80pw)*(1+ r) +(4/16)w = 240pi
Eq2b: (40pi + 100pc + 120pw)*(1+ r) +(4/16)w = 360pc
Eq 3b: (40pi + 40pc + 200pw)*(1+ r) +(8/16)w = 480pw
We get a fourth equation by setting the net national income for this “Standard” system equal to 1. The coefficient for the first term below is the total value of iron output (240pi) minus the total value of iron input (120pi+ 40pi +40pi). The other two terms are determined the same way.
Eq4b: 40pi + 60pc + 80pw = 1
Now if we solve this system of equations (the Standard System) for different values of r, this is what we come up with for values of w:

The Standard System has the same maximum surplus rate (or profit rate) as the “actual” system (20%) but the relationship between r and w is clearly a simple straight line given by the equation
w= 1 - r/R, where R is the maximum profit rate
Sraffa calls R the Standard Ratio. Eq4b, in addition to giving you the Standard National Income, also gives you the proportions that make up the Standard Commodity for the specific “actual” system we are considering. It is 2 parts iron, 3 parts corn and 4 parts wheat.
Expressing the “actual” system in terms of the Standard Commodity
Now let’s combine the first three equations of the “actual” system with the equation that establishes the Standard Commodity.
Eq 1: [90(1+r)-180)]pi + 120(1+r)pc + 60(1+r)pw + 3/16w = 0
Eq 2: 50(1+r)pi + [125(1+r)-450]pc + 150(1+r)pw + 5/16w = 0
Eq 3: 40(1+r)pi + 40(1+r)pc + [200(1+r)-480]pw + 8/16w = 0
Eq4b: 40pi + 60pc + 80pw = 1
Remember that setting pi=1 was one way to make the actual system solvable. Setting the national income of the “actual” system equal to one was another way. Now we are doing it a third way: by using Eq4b to express the prices of our “actual” system in terms of the Standard Commodity.
Below are the values of w that we get for different values of r
As in the Standard System, a simple straight line describes the relationship between w and r.
Pasinetti explained: “it is at last possible to state rigorously that the shortcomings and inadequacies of the Classical pure labor theory of value, or indeed the abandonment of such a theory, leave quite unscathed the possibility of treating the distribution of income independently of prices”.
I’ll have more to say about Sraffa’s Standard Commodity and the labor theory of value in future posts. Incidentally, I was prompted to explore this by the very thought-provoking Ian Wright essay that is posted on RedSails.org.
NOTES:
[1] I used Excel’s matrix inversion and multiplication functions to solve the equations.
[2] How did Sraffa come up with the multipliers for Eq1, Eq2 and Eq3? He solved this system of equations for the multipliers (q1, q2 and q3) as well as R, the Standard Ratio
(90q1 + 50q2 + 40q3)(1 + R) = 180q1
(120q1 + 125q2 + 40q3) (1 + R) = 450q2
(60q1 + 150q2 + 200q3)(1 + R) = 480q3
q1(3/16) + q2(5/16)+ q3(8/16) = 1
The coefficients of the first three equations have rows and columns transposed from the “actual” system. Why? By transposing rows and columns, his multipliers create a Standard System where the ratio of output to input for each commodity is independent of price:
[Value of wheat outputted / Value of wheat inputted] = 1 + R
and similarly for corn and iron.
Wright’s essay is great, if pretty difficult for those of us with limited maths. Likewise for Farjoun and Machover, Cockshott and Cotrell, and some of the econophysics peeps. Much needed discussion